

Business analytics is no longer just about describing what happened—it’s about predicting what will happen and prescribing what to do next. AI supercharges this shift by automating analysis, revealing non-obvious patterns, and making insights accessible to everyone—not just data scientists. Whether you’re tracking customer behavior, operational efficiency, or financial performance, here’s how to harness AI to make your analytics smarter, faster, and more actionable.
1. Automate Data Preparation & Cleaning
Up to 80% of analytics time is spent wrangling data. AI slashes this:
- Smart data connectors (in Power BI, Tableau, Google Looker Studio) auto-sync data from CRMs, ERPs, ads, and spreadsheets.
- AI-powered cleaning (e.g., Microsoft Power Query AI, Trifacta) detects outliers, fills missing values, and standardizes formats—no manual rules needed.
Result: Spend minutes—not days—getting data ready for analysis.

2. Discover Hidden Patterns with Machine Learning
AI finds what humans miss in large datasets:
- Anomaly detection: Flags unexpected changes—e.g., “Website conversions dropped 35% today—unusual for Mondays.”
- Clustering: Automatically segments customers (e.g., “High-value but at-risk” vs. “Loyal bargain hunters”).
- Correlation mining: Reveals hidden drivers—e.g., “Users who watch tutorial videos have 3x higher retention.”
Tools like Power BI’s “Key Influencers” or Qlik Sense surface these insights automatically.
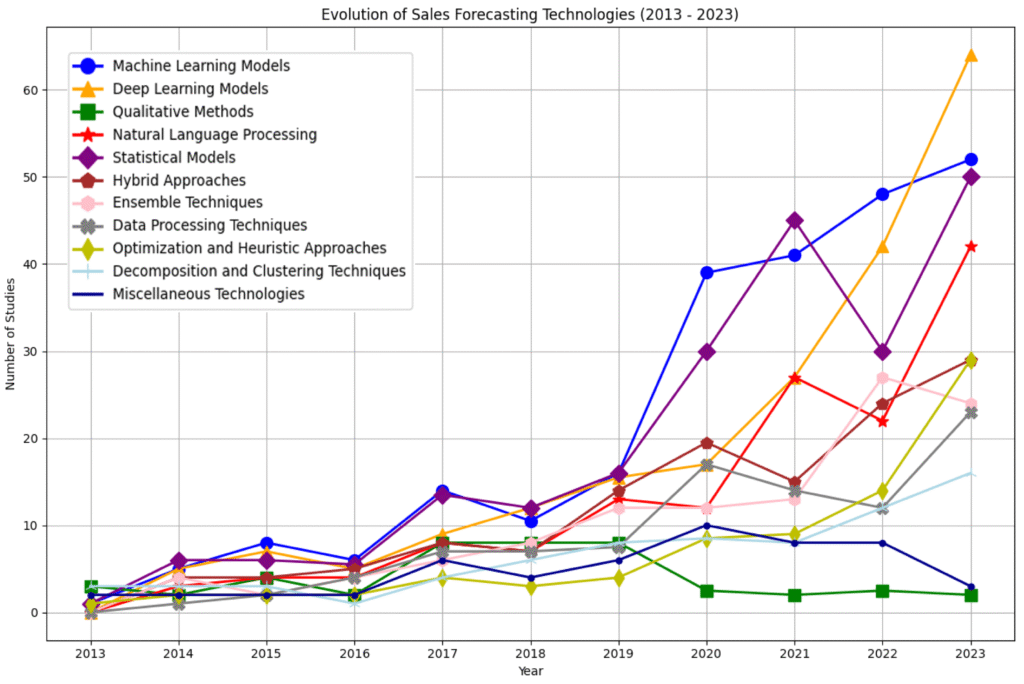
3. Predict Outcomes with Forecasting Models
Move from hindsight to foresight:
- AI forecasting in Excel, Power BI, or Sisense predicts sales, churn, inventory needs, or campaign ROI using historical trends and external factors.
- Adjust variables interactively: “What if we increase ad spend by 20%?” → AI simulates outcomes instantly.
Example:
AI model predicts 18% churn risk in Segment B → team launches retention campaign → saves $250K in lost revenue.
4. Ask Questions in Plain Language
Democratize analytics with natural language querying:
- Type or speak: “Show me top-performing products in California last quarter”
- Tools like Power BI Q&A, Tableau Ask Data, or ThoughtSpot instantly generate charts and tables.
- Non-technical users explore data independently—no SQL or dashboard-building required.
This turns analytics from a specialist function into a company-wide capability.
5. Generate Automated Insights & Narratives
Stop writing repetitive reports. AI drafts them for you:
- Microsoft Copilot in Power BI or Tableau’s Explain Data auto-generates plain-English summaries:“Revenue grew 12% MoM, driven by Enterprise segment in EMEA.”
- Schedule AI-powered email digests that highlight only the most relevant changes for each stakeholder.
This ensures leaders get timely, personalized insights—without dashboard overload.
FAQs
Q: Do I need to know coding or machine learning to use AI in analytics?
A: No. Modern tools embed AI with simple UIs—no technical skills required. Focus on asking the right business questions.
Q: What’s the best tool to start with?
A: If you use Microsoft 365, start with Power BI + Copilot. Google users can explore Looker Studio + AI insights. Both integrate with existing workflows and offer free tiers.
Q: Is AI accurate enough for critical decisions?
A: AI augments—not replaces—human judgment. Always validate predictions with domain knowledge and test recommendations on a small scale first.
AI transforms business analytics from a rearview mirror into a GPS for your organization’s future. By automating routine tasks, revealing deep insights, and forecasting with confidence, AI empowers every team to act on data—faster and smarter. Start with one AI feature in your current analytics stack, measure its impact, and scale from there. The future of analytics isn’t just visual—it’s intelligent, intuitive, and profoundly human-led.